
Note: This is an Excerpt from the Fund Balance 2013 Review/2014 Outlook — Section III: Solar Stocks 2014.
By Walter Borden
Fund Balance Here Comes The Sun ETF Performance for 2013:
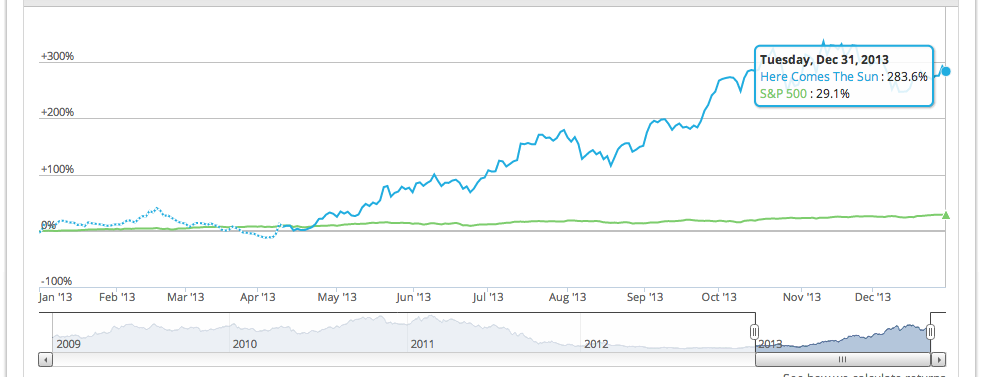

One of the most widely held ETFs, the Guggenheim Solar ETF (TAN in the chart above), returned 131.3% YTD and –54.96% over the last 5 years.
Solar power investments performed tremendously in 2013. Commercial users of solar power such as Walmart, GM, Staples, and Walgreens are just now scratching the surface of what is possible in terms of balance sheet energy cost saving and carbon footprint reductions. Current installed solar production is minimal compared to overall energy consumption, though a paucity of data which is closely held by most suppliers and users, makes gauging returns on capital and cost efficiencies inexact.
From an asset management point of view, as the solar power industry matures buying opportunities become more difficult to spot. We urge growth investors to hold and build positions in companies with long term stable cash flows and to keep some powder dry for nascent prospects in smart-grid, storage, and supporting software and services such as Power Secure International which returned ~130% in 2013. Investors with short time horizons are advised to explore capturing some profit in the first quarter of 2014.
As 2014 unfolds, potential interest rate increases from reduced monetary stimulus as well as policy uncertainty stemming from upcoming expiration dates for tax credits early in 2016 will guide discrimination between long term positions and short term ones in solar power.
New solar Photovoltaic (PV) installations grew at a rapid pace in 2013 to 36 GWs. The cost competitiveness of this electric power source shows rapid improvement as well. While utility-scale PV installations are not yet cost competitive with fossil fuel power plants, commercial-scale installations have attained cost parity in that generation costs of power from solar PV is comparable to the retail electricity prices that commercial users pay in key economic regions.
In the US, demand will continue to pick up in 2014. Still just 5 states have 82% of all US solar installs. In immature markets in the Southeast, with Georgia showing leadership in both its initiatives as well as its withdrawal of tariffs, which are still in place in other states. We see large opportunities here. Their tariffs on solar generation amount to a penalty on home based solar power generation while voters and stakeholders are taking notice. Leading markets in the Northeast and Western United States remain robust and highly competitive. Hawaii also has stuck with its plan for widespread solar usage in order to wean itself from fossil fuels for residential and many types of commercial power. All of this reinforces a key trend: Over 2014 consistent growth will continue as the cost of solar comes down and the cost of other energy sources goes up.
California continues to lead the solar PV charge, installing 455 megawatts in Q3; North Carolina moved into the No. 3 spot in total PV installations with 23 percent growth. Nevada moved from 17 to 5 and Vermont from 21 to 12 in the rankings.
Commercial-scale installations could reach ‘‘grid parity’’ in about ten years, if the current federal tax incentives for solar power were to expire at that point rather than sooner.
Impact investors should look to solar stocks in 2014 that are performing well at its outset. Fund Balance expects a continuance of 2013 trends in the near and mid-term. The same can be said for the broader array of underlying macroeconomic conditions. Throughout 2014 demand driven by system prices will slow somewhat after market absorption of significant 2013 price reductions on the heels of the industry wide buffeting in 2012.
The Price Story
Price stability helped solar market growth while capacity and supply shrunk as companies went out of business (Suntech Power and LDK Solara are two examples). Demand however steadily picked up. A long awaited EU-China solar trade agreement bodes well for international price stabilities. Chinese manufacturers are not signaling plans for expanding or upgrading solar plants until at least 2015 as even its best manufacturers continue to shrink bloated balance sheets. As Chinese banks appetite for solar risk subsides after the three voracious years shrinks, we expect steady mostly unchanged supply levels from China in 2014.
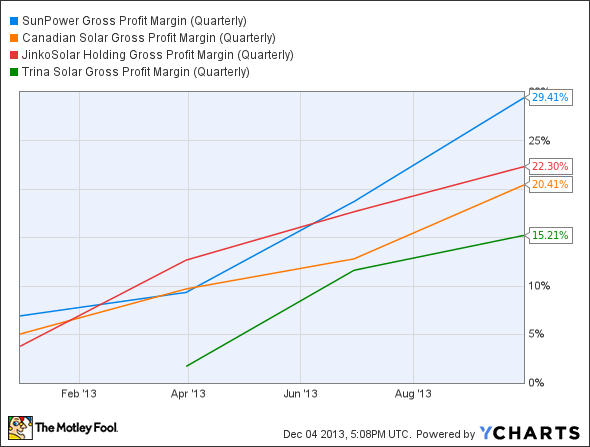
In the a US in 2013, increasing demand for solar power and stable pricing in the second half of 2013 provided strong support to manufacturers. Once struggling to break even, SunPower (NASDAQ: SPWR), Canadian Solar (NASDAQ: CSIQ), JinkoSolar (NYSE: JKS), and Trina Solar (NYSE: TSL) are now profitable and richly valued.
Trends look in their favor though volatile short interest is high. Has the market priced this trend into their asset prices and valuations?
Overall then, gross margin trends over the past year for these companies improved rapidly as a result of the aforementioned better pricing as did cost reductions from 2012 when the industry was in a far worse position.
If demand hits many analyst’s upper range of 46 GW in 2014 and as little new capacity is scheduled to come online in 2014, these growth trajectories will continue upwards. For example, SunPower’s 350 MW expansion will not come online until 2015. Margins for producers with scale will continue to improve and sustain market valuations albeit attached with worries of irrational exuberance.
The highest quality suppliers have seen the biggest benefit so far and we think that is where the gains will be this year as well. We think the smart bet is on a profitable company making even more money as the industry improved than a high risk debt ridden company turning things around.
The Bear Case for Solar
On the risk side, at present and into 2014, the primary risk factors for the sector are three fold:
Firstly, standardization and securitization will continue to improve in the financing of new solar assets. Tax equity will remain in place for residential installations. Utility scale investments will get more competitive. Complex deal structures which result from legal and consulting costs along with an absence of standardization will continue to increase costs of capital. Financing will primarily be available to utilities that can roll-out new solar power capacity at large scales. Technical risk while ever present, has lessened as well in the present innovation cycle, though we project it to continue as a cost driver.
Secondly, in the late 2014 electricity rates will likely experience upward pressure from scaled back government incentives and new supply constraints. Policy uncertainty (as discussed in Section II) will continue to show wide variability state by state. This should be measured against a more steady and coherent pattern of modest policy support expansion via Solar Energy Renewable Certificates (SRECs). Some encouraging signs in regions with long-standing policy and legacy, vested economic interest led resistance to renewables will unfold in 2014. Georgia is one example. Looking out on the 3-5 year horizon, the Solar Investment Tax Credit (ITC), scheduled to expire in 2016, is one of the most important policy mechanisms in the deployment of solar energy in the United States. A rapid scale-back of ITCs will detrimentally impact the US solar power industry. Hysteresis in the form of backlogged capacity from rapid capex retrenchment are still noticeable in Germany, the US and China. This should abate in 2014 as well.
Thirdly, cost per watt averages are dropping while costs for skilled labor are not. Some observers think that labor costs are problematic for the industry growth prospects. And indeed automation is on the rise in manufacturing and maintenance. The Fund Balance view is that these concerns are overstated as increases in labor costs will primarily allow more consumer discretionary income as well as increase energy demand. That said targeted automation will be an opportunity and bring lower prices to market. Nonetheless we see a the broader lift from increased minimum wages in key markets as engendering more equitable wages and growth. This will more than offset higher costs in the supply chains and increase on-grid peak demand/delivery ratios.
By comparison, the endogenous challenges in 2014 for the solar industry over the past three years really converge on
the fundamental economic concepts: supply and demand and inflation. With 70 GW of solar module capacity available in the market and only about 32 GW installed in 2012, this imbalance brought plunging module prices and the culling of many solar panel manufacturers worldwide.
The Breakthrough Institute published a thought-provoking comparison of nuclear and solar for US mid and long term energy demand. It concludes that nuclear is the essential component of the US low carbon energy mix and further that solar advocates have gotten ahead of reality in terms of technology and usage growth rates. Notably, the study acknowledges that policy changes around unburnable carbon, i.e. a possible carbon bubble, are not factored into its analysis.
Buy, Sell, or Hold SolarCity?
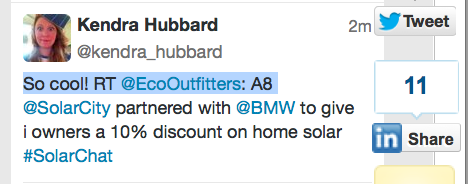
A case in point is the bearish view of SolarCity (SCTY) held by many market participants. Bulls argue that SolarCity is a distributed power “killer app” poised to disrupt traditional power grid revenue models. Contrarians aver that SolarCity is far too dependent on SRECs and other tax incentive supports. Roughly one in five SolarCity shares are being shorted while its stock surged ~340% in 2013.
Still, the short thesis is that SolarCity is not profitable now, and it has little hope of achieving that in the foreseeable future as its strong growth will stall when the current 30% investment tax credit presently in place drops to 10% come Jan. 31, 2016. Bears also note that most states limit net metering, which allows property owners to sell the energy they don’t use back to their local utility at above-market rates. California, SolarCity’s largest market, could reach that limit by late 2014.
Worse yet, doubters and short sellers point to SolarCity’s assumed discount rate of 6%, unusually low for such a young firm given that the typical 10% rate in net present value assumptions. Plugging this 10% rate in yields a much lower valuation than reflected by the current market price.
With all this in mind, we rate this firm a hold over the short-term with a recommendation to accumulate on dips. A close eye on revenue growth is thus advisable. The viability of its relationship with TESLA, and of course, its ability to transform away from potential over dependency on subsidies bear monitoring as well.
Even still, as the runaway bull market for solar continues into 2014 expect story stocks like SCTY, which trade on perception as much as potential and current fundamentals to move upward in sync. SCTY (and other market leaders with scale) enjoy the keyword effect of “disruptive potential” and a “modern day Thomas Edison” in Elon Musk as chairman along with astounding growth in terms of megawatts deployed. SCTY had 109% growth overall and 151% growth in the residential segment for Q3 2013 versus last year Q3 2012. As an example of falling costs, SolarCity’s operational costs/watt has come down over the past quarter from $0.80/watt in Q2 to $0.59/watt and this looks poised to continue.
SCTY’s high stock price will allow faster growth by allowing its stock to be a currency to buy companies, which if executed well will also deliver higher growth and a higher stock price. So the positive cycle will then continue.
Finally, insiders are not selling their shares rather they are buying. Chairman Musk purchased over 200,000 shares and CEO Lyndon Rive purchased over 100,000 shares in SolarCity’s most recent secondary offering.
![]()
Fund Balance Outlook: Market Growth for Solar Power
Our 5 year view for the solar power market in the US depends on the following contingencies:
How soon solar can replace coal in the US energy portfolio and to what extent can it compete with Liquified Natural Gas (LNG) in the US energy portfolio?
Other key questions: to what extent may the US be nearing the end of the golden age of natural gas? An observed and familiar pattern may be forming of 2 year boom/5 year bust cycles in energy for LNG — yet with LNG on trend for growth in the US energy mix for decades to come, barring unforeseen regulatory and societal interventions, past may not be prolog in this case. Furthermore a new study reports findings that hydrofracking uses less water than coal. They estimate that the water saved by switching from coal to natural gas is 25 to 50 times greater than the amount of water used in fracking to extract the shale gas in the first place.
Will solar achieve grid parity with LNG in the next decade? As noted above, likely yes. Will it surpass LNG or nuclear as a constituent of the US energy mix? Very likely not. All being roughly equal and despite a 72% drop in gas-directed drilling since its peak of 1,054 rigs in Sept. 2009, U.S. dry production of LNG will continue to grow through 2014 with modest busts preceding larger booms into the end of this decade.
Yet here again history never repeats itself the same way twice. For example, an early signal of trouble for LNG supply is the passing of the nation’s strictest ordinance restricting of Hydraulic Fracturing or “fracking” by the city of Dallas, in the heart of the Barnett Shale boom economy. Fossils in general have considerable increasing fuel price risks. Even with further lowered LNG prices and un-utilized LNG capacity, strains of local aquifers and water sheds will continue to inform the regulatory arena.
What Does Reactive Power Mean For Renewable Energy Asset Stewardship and Investment Strategy?
From a top down perspective, the DNA of the energy sector is digital and edge of grid. It will involve the convergence of solar, grid operations, and storage. Growth of these multiple revenue streams from distributed energy generation means a high-penetration PV future. Further opportunities will arise as electric car infrastructure merges with solar storage to supplement battery advances.
The electrical grid has a fundamental need for reactive power and, in some cases, the requirement to avoid instabilities via reactive power feed-in. A new generation of inverters satisfy this requirement, making reactive power available even outside of normal feed-in periods. By utilizing reactive power during the day – and at night – utilities leverage the use of existing equipment and avoid stand-alone solutions, resulting in performance improvements. We expect to see ample opportunities for ethical capital stewardship in this area.
The electrical grid has a basic need for reactive power. Obverse to this need is a requirement to avoid instabilities via reactive power feed-in. Learning curves are slow with utilities, and this will impede higher rates of solar uptake in utilities and so load shaping and peak shaving will be the primary growth areas for reactive in the near term for solar.
Early stage growth opportunities for longer stewardship planning will present themselves via the adoption as the IEEE 1547 standard:
[A] tight underfrequency protection setting of 59.3 Hz which poses a risk for grid stability. In case of an underfrequency situation,[3] e.g. after a major loss of generation, the situation may get worse when a multitude of distributed energy resources (DER) disconnect simultaneously. IEEE 1547-2003 demands also an obligatory overfrequency disconnection at 60.5 Hz. With a rising share of distributed generation there is a possibility of triggering a non-linear oscillator in the multi GW range within the transmission grid. In Europe, this problem with similar standards has already been addressed by ENTSO.
In addition to inverters and microinverters, more compact and efficient heliostats are being used used for daylighting and heating. Instead of many large heliostats focusing on a single target to concentrate solar power (as in a solar power tower plant), a single heliostat usually about 1 or 2 square meters in size reflects non-concentrated sunlight through a window or skylight. A small heliostat, installed outside on the ground or on a building structure like a roof, moves on two axes (up/down and left/right) in order to compensate for the constant movement of the sun. In this way, the reflected sunlight stays fixed on the target (e.g. window). An example of this is Genzyme’s corporate headquarters of in Cambridge, Massachusetts, which uses heliostats on the roof to direct sunlight into its 12-story atrium.
Finally, Fund Balance expects to see more and more focus on behind the smart inverter standards and behind the meter software applications to complement significant opportunities in storage. For many, storage is about physical and lifeway security, not just sustainable economics and this demand is being met as we are seeing availability of economical storage such as 300MW pump storages.
At Fund Balance we are cautiously optimistic for 2015 and 2016 that these and doubtless other technological innovations will surprise on the upside as smart grid applications begin to instantiate themselves at the point of usage be they residential, commercial, or utility-based.
Conclusion:
2013 will go down as a record-shattering year for the U.S. solar industry. It created thousands of American jobs, saved much needed income for U.S. consumers, reduced pollution nationwide, and lessened societal dependence on unstable/unburnable foreign energy supplies. The Fund Balance view is that the surface is just being scratched in terms of this our industry’s enormous potential. Parenthetically, we think this true of of Impact and Sustainable Investing as well.
The residential market continues to see the most rapid growth of any segment in the U.S. PV market. Through Q3, residential PV installations were up 49 percent year-over-year, driven largely by progressive state renewable energy initiatives.
Will a solar energy bubble form in 2014? Likely not. For Fund Balance and the market at large, 2013 was a great year for investment in solar companies, both operationally and in value creation. We forecast steady demand grow in 2014 indicating that long term investment and asset stewardship planning should center on holding tight in the periods of profit-taking.
It is dangerous to short stocks and sectors in a bull market without a near-term trigger. In 2014 the market will be focused only on growth metrics and solar is delivering. While growth will slow as tax incentives are reduced in late 2015 into 2016, falling solar costs will eventually make the rooftop solar companies profitable.
The distributed power market, led by SolarCity and SunPower will continue to present opportunities. Big institutions such as Goldman Sachs and Total are in. Access to cheap capital will remain in place for the time being as the market prices in a rising interest picture. Cautions should be used in assessing smaller companies due to lack of such factors, though they may make good acquisition targets.
For the broader market:
-
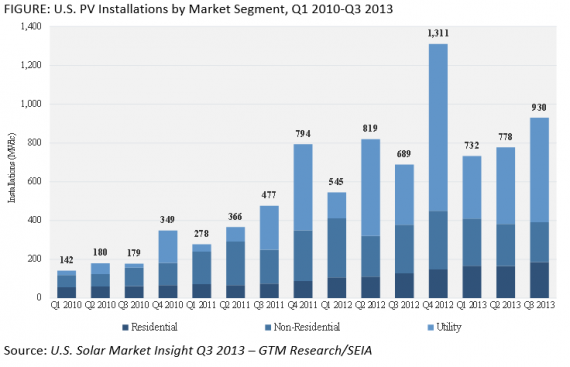
PV installations reached 930 megawatts in Q3 2013, up 20 percent over Q2 2013. This represents the second-largest quarter for solar installations in U.S. history.
-
The utility solar sector represented more than half of new PV capacity installed, but the residential market also showed impressive growth with 12 percent expansion over Q2.
-
The non-residential market remains flat; however, Fund Balance is not alone in anticipating a robust resumption of growth in 2014.
-
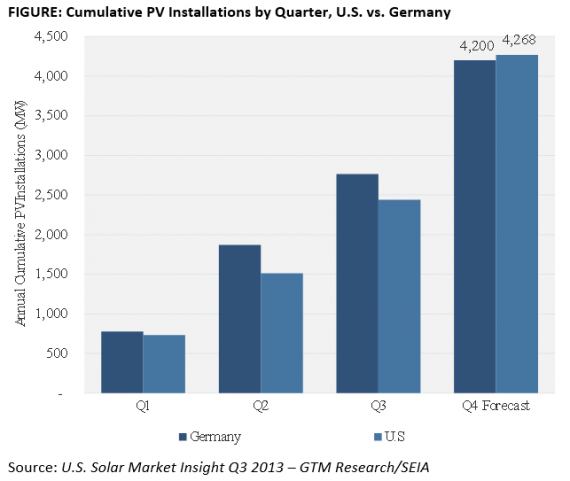
2013 is likely the first year in recent history in which the U.S. installs more solar capacity than Germany.
Blended average PV system prices fell 4.2 percent in Q3 2013, reaching a new low of $3.00 per watt.
-
The U.S. will install 4.3 gigawatts of new PV in 2013, up 27 percent over 2012 with the the 392 megawatts Ivanpah CSP project scheduled to begin delivering electricity to the grid before the end of 2013.
In general firms need to:
- Innovate around the permanent benefits and use the subsidies as a bonus;
- Stay attenuated to key regulatory leadership such as California’s Rule 21, Georgia’s Advanced Solar Initiative, and Hawaii’s broad embrace of Solar as a fossil fuel risk mitigator.
-
Assess regulatory certainty/uncertainty in the marketplace which is often as important as value propositions
-
Mind customer aquistion costs which are still high in US; $.49 in US; $.07 in Germany
- Consider using interest rate hedges
Solar was the second-largest source of new electricity capacity in the U.S. in 2013, trailing only natural gas, according to GTM Research: “As solar continues its march toward ubiquity, the market will require continued innovation, efficiency improvement and regulatory clarity. But already the groundwork has been laid for a mainstream solar future.” In sum with solar Fund Balance anticipates more booms than bubbles
.
